SOLIDWORKS Mold Flow Analysis
How One Engineer Stopped Burning Through Tooling Budgets and Started Building Perfect Plastic Parts on the First Try

Every rejected mold is a lesson you paid full price for. Here's how to stop paying.
The Stool That Changed Everything
Priya Nakamura stared at the cracked plastic stool on the conference room table and felt her stomach drop.
Six weeks of design work. Three rounds of tooling revisions. A production run of 10,000 units — and now customer returns were flooding in. The stools cracked along the same seam every time, right where the legs met the seat. Her team at a mid-sized furniture manufacturer had followed every guideline in the material datasheet. They'd checked wall thickness. They'd verified the ABS material spec.
But nobody had run a mold flow analysis.
"We thought simulation was overkill for a stool," Priya admitted later. "We'd made hundreds of stools before. What we didn't realize was that this new design — thinner walls, a wider seat, a different gate location — had completely changed how the plastic filled the mold."
The cracks weren't random. They formed exactly where weld lines intersected with stress concentration points. The air traps nobody anticipated had created burn marks inside the thickest sections. And the sink marks on the seat surface? Those came from non-uniform volumetric shrinkage that a five-minute simulation would have flagged.
That cracked stool cost the company the equivalent of an entire quarter's profit margin on that product line.
Priya's story isn't unusual. Across every industry that relies on injection-molded plastic parts — automotive, consumer electronics, medical devices, furniture, packaging — engineers make the same costly assumption: "We've done this before, we don't need simulation."
This post is for Priya. It's for you. It's for every engineer, designer, mold maker, and product manager who has ever watched a perfectly good design fail on the production floor because nobody understood what was happening inside that mold cavity.
You're about to learn every critical concept in SOLIDWORKS Mold Flow Analysis — not as dry theory, but as the toolkit that turned Priya from a reactive problem-solver into an engineer who catches defects before they ever exist.
Part One: The Status Quo — Designing in the Dark
Why "Experience" Alone Fails You
Before Priya discovered mold flow simulation, her team designed plastic parts the way most teams still do: based on material datasheets, design rules of thumb, and hard-won shop floor experience.
And for simple parts, that works. A basic rectangular container with uniform wall thickness and a single gate? Experience will get you there.
But modern plastic parts aren't simple. They have:
- Variable wall thicknesses that create competing flow paths
- Complex geometries with bosses, ribs, snap fits, and through-holes
- Multiple gate locations that generate unpredictable weld line patterns
- Tight tolerances that demand precise control of shrinkage and warpage
- Aesthetic requirements that make surface defects unacceptable
When Priya's team designed the new stool, they changed four variables simultaneously: wall thickness, seat geometry, gate location, and rib configuration. Each change alone might have been manageable. Together, they created a filling pattern that no amount of experience could have predicted.
The fundamental problem: injection molding is a thermodynamic, fluid-dynamic, time-dependent process happening inside a sealed metal box at high pressure and temperature. You can't see what's happening. You can only see the result — and by then, the tooling budget is spent.
The Real Cost of "We'll Fix It in Production"
Here's what the "fix it later" approach actually costs, broken down into categories that hit your bottom line:
| Cost Category | Without Simulation | With Simulation |
| Tooling Revisions (average per mold) | 2–4 revisions | 0–1 revisions |
| Cost Per Tooling Revision | 10–30% of original tool cost | Minimal (design file changes only) |
| Scrap Rate (first production run) | 5–15% | Less than 1% |
| Time to First Acceptable Part | 8–16 weeks | 4–8 weeks |
| Customer Returns (defect-related) | 2–8% | Less than 0.5% |
| Engineering Hours on Root Cause Analysis | 40–120 hours per defect | Near zero (defects prevented) |
| Production Downtime for Mold Rework | Days to weeks | Avoided entirely |
Priya's cracked stool fell squarely into the worst-case column. Multiple tooling revisions. High scrap rates. Customer returns. Engineering hours burned on forensic analysis of failures that simulation would have predicted in minutes.
The design phase is where you have maximum leverage. A change to a CAD model costs almost nothing. A change to a hardened steel mold costs a fortune.
What Mold Flow Analysis Actually Does
SOLIDWORKS Plastics Simulation does something remarkably powerful: it lets you watch plastic fill a mold cavity before you ever cut steel.
The software simulates the four main stages of injection molding:
- Flow — How molten plastic enters and fills the cavity
- Pack — How pressure is applied after filling to compensate for shrinkage
- Cool — How the part temperature drops to ejection temperature
- Warp — How the part deforms after ejection due to residual stresses
For each stage, the software generates detailed plots that reveal exactly what's happening inside the mold at every point in time and space. These plots are your X-ray vision into a process you'd otherwise have to diagnose through trial and error.
Priya's team analyzed their stool model using SOLIDWORKS Plastics with ABS material. What they found in simulation explained every single production defect — and pointed directly to the fixes.
Let's walk through every plot, every concept, and every decision point, exactly as Priya learned them.
Part Two: The Inciting Incident — Running the First Simulation
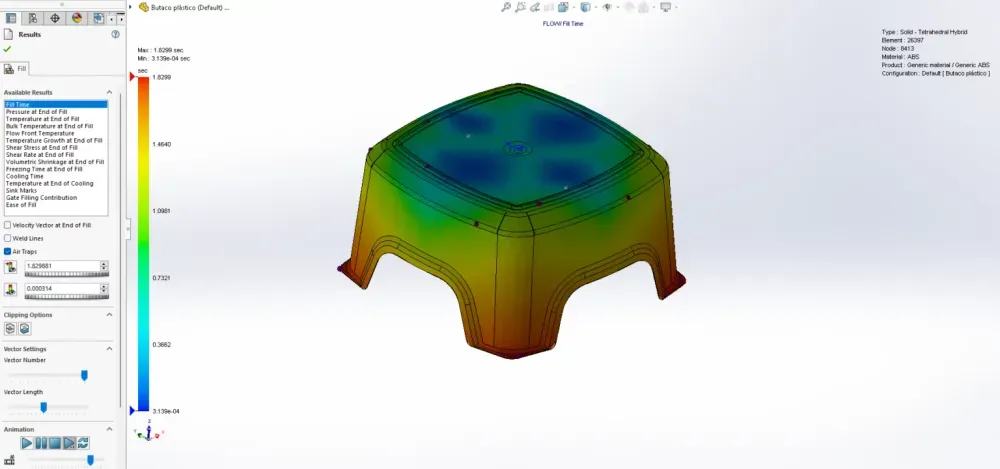
Fill Time: Watching Plastic Flow in Real Time
The first simulation Priya ran was the fill time analysis. It was the moment everything clicked.
The fill time plot shows you exactly how molten plastic courses through the mold cavity during injection. It's an animated color map that tells a complete story:
- Blue regions mark where the flow front begins — the injection point
- Red regions mark where the flow front arrives last — the "end of fill"
- The color spectrum between them shows the elapsed time for the flow front to reach each region of the cavity
For Priya's stool, the filling pattern started at the center injection point (blue) and radiated outward, with the flow front reaching each corner of the seat last (red).
The critical insight: the corners farthest from the injection site always fill last. The duration of filling depends on flow length and several interacting factors:
Fill Time Depends On:Flow length — the distance from gate to furthest cavity pointWall thickness — thinner walls create more flow resistanceMaterial viscosity — higher viscosity slows flowMelt temperature — higher temperature reduces viscosityInjection pressure — more pressure drives faster fillPart geometry — ribs, bosses, and thickness changes redirect flow
When Priya reviewed the fill time plot for her stool, she immediately noticed something wrong: the four legs didn't fill simultaneously. Two legs filled nearly a full second before the other two. That asymmetry — invisible in the CAD model — was the root cause of the weld line failures.
What you should look for in your fill time plot:
- Symmetric fill patterns — all extremities should fill at roughly the same time
- No regions that fill dramatically later than others (these will have packing problems)
- Smooth, progressive color transitions — sudden jumps indicate flow hesitation
- Short shot indicators — red regions that don't fill at all
Injection Locations: The Single Most Important Decision
"If I could go back and change one thing," Priya said, "it would be where we put the gate."
The injection location is the point where melted plastic enters the mold cavity. The end of fill is the last area to be filled — typically the thinnest wall sections or the regions furthest from the gate.
This relationship between gate and end-of-fill governs almost everything about part quality.
The Gate Location Principle:
When the flow length is too long for a gate positioned at one end of the part, the mold cavity can't fill completely. The solution is to move the injection location to a central point. This achieves two things:
- Reduces flow length by approximately half — plastic now travels in two directions from the center
- Reduces injection pressure requirements — shorter flow means less pressure drop
- Creates more uniform fill — extremities fill simultaneously
However, changing the gate location isn't without tradeoffs. A centrally placed gate can cause the melt to reach one end before the other if the part geometry isn't symmetric, leading to non-uniform filling.
How to evaluate your injection location:
Review the fill time plot with this checklist:
- [ ] Do the extremities of the cavity fill simultaneously?
- [ ] Is the fill pattern symmetric relative to the injection location?
- [ ] Are there regions where the melt arrives significantly earlier or later?
- [ ] Does the flow path create acceptable weld line positions?
For Priya's stool, the original gate was at the edge of the seat — essentially making the flow length the entire diameter of the seat. Moving it to the center cut the flow length in half and equalized the fill pattern across all four legs.
An uneven filling pattern leads to:
- Non-uniform packing pressure distribution
- Inconsistent volumetric shrinkage across the part
- Post-molding problems: warpage, sink marks, dimensional variation
- Weld lines in structurally critical locations
The Flow Length vs. Pressure Relationship
Here's the engineering behind why gate location matters so much:
Pressure Drop (ΔP) ∝ (Flow Length × Viscosity × Flow Rate) / (Wall Thickness³)
This proportionality tells you everything:
- Double the flow length → Double the pressure drop
- Halve the wall thickness → 8× the pressure drop (cubic relationship!)
- Higher viscosity materials → Higher pressure drop
Moving the gate to the center doesn't just halve the flow length — it halves the pressure requirement, which means you can use lower injection pressures, which means less stress in the part, which means fewer defects.
| Gate Position | Effective Flow Length | Relative Pressure Requirement | Fill Uniformity |
| End of part | Full part length (L) | Highest (baseline) | Poor — one end fills first |
| Center of part | Half part length (L/2) | ~50% of baseline | Good — both ends fill simultaneously |
| Off-center (optimized) | Varies | Optimized for geometry | Best — tuned for asymmetric parts |
| Multiple gates | Shortest segment | Lowest per gate | Complex — creates weld lines |
Part Three: The Struggle — Confronting Every Defect
Air Traps: The Invisible Saboteur
The second simulation Priya ran revealed a problem she'd never even considered: air traps.
During injection, the mold cavity is full of air. As plastic flows in, that air needs somewhere to go. In a well-designed mold, the air escapes through parting line vents, ejector pin clearances, or porous inserts.
But when two flow fronts converge, or when plastic surrounds a pocket of air faster than it can escape, the air becomes trapped.
What trapped air does to your part:
- Prevents complete filling — the air pocket physically blocks plastic from reaching that region
- Prevents proper packing — trapped air is compressible, but it resists being compressed enough for full pack
- Can ignite under compression — this is called "diesel effect," and it causes burn marks on the part surface
- Damages mold surfaces — the ignited air can erode or pit the cavity and core steel
Priya's stool had air traps at three of the four leg tips. The mold had ejector pins at those locations, but the pin clearances weren't providing enough venting for the ABS material's flow characteristics.
Solutions for air traps (in order of preference):
- Redesign flow path to eliminate converging fronts that trap air — best solution, no tooling change
- Parting line vents at trap locations — thin slots (typically 0.025–0.05 mm deep for ABS) along the parting line
- Ejector pin venting — utilize clearance around ejector pins for air escape
- Cavity inserts at trap locations — replaceable inserts with micro-channels
- Porous metal inserts — sintered metal inserts that allow air through but block plastic
The best approach is always to avoid air traps in the first place. The fill time plot combined with the air trap plot in SOLIDWORKS Plastics shows you exactly where they'll form — before you cut steel.
Weld Lines: Where Strength Goes to Die
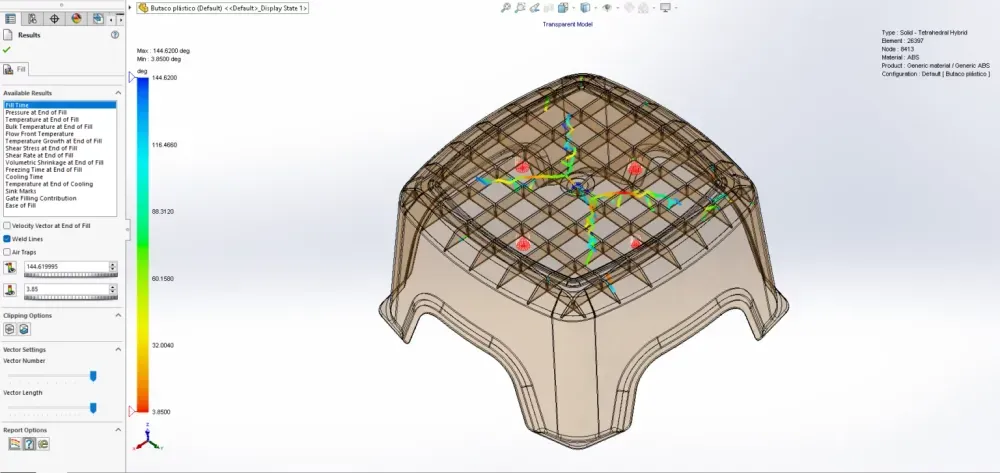
When Priya overlaid the weld line plot on the structural analysis of her stool, the failure mode became crystal clear.
Weld lines form when two or more plastic melt fronts merge. They're inevitable in any part with:
- Through-holes (the melt splits around the hole and rejoins on the other side)
- Multiple injection locations (each gate creates a separate flow front)
- Mold shut-off surfaces (features that interrupt flow)
- Wall thickness variations (thicker sections fill faster, creating secondary flow fronts)
Why weld lines matter:
- Reduced strength — the molecular chains at a weld line are poorly entangled, creating a weak bond
- Visual defects — weld lines are often visible as faint lines or discoloration on the part surface
- Stress concentration — the weld line acts as a notch in the material, focusing stress during loading
Weld lines typically form 180 degrees opposite to the point where the melt front meets a standing core or shut-off surface.
The uncomfortable truth about weld lines:
You cannot eliminate weld lines entirely. Any part with through-holes or multiple gates will have them. You can only control where they form by changing the injection location.
For Priya's stool, the weld lines formed at the junction between the seat and legs — the highest-stress region during use. By moving the gate, she repositioned the weld lines to regions under compression rather than tension, where their reduced strength mattered less.
Weld line strength as a percentage of base material strength:
| Material | Weld Line Strength (% of base) | Notes |
| ABS (unfilled) | 75–90% | Relatively good weld strength |
| Polypropylene (unfilled) | 80–95% | Excellent weld performance |
| Nylon (glass-filled) | 40–60% | Fillers dramatically reduce weld strength |
| Polycarbonate (unfilled) | 70–85% | Sensitive to melt temperature at weld |
| POM / Acetal | 60–80% | Crystalline materials weld less effectively |
Design rules for managing weld lines:
- Position gates so weld lines form in low-stress, non-visible areas
- If weld lines must exist in structural areas, increase local wall thickness
- Use higher melt temperatures to improve molecular entanglement at the weld
- For filled materials, expect significantly reduced weld line strength
- Consider post-mold annealing for critical weld line locations
Velocity Vectors: Reading the Molecular Fingerprint
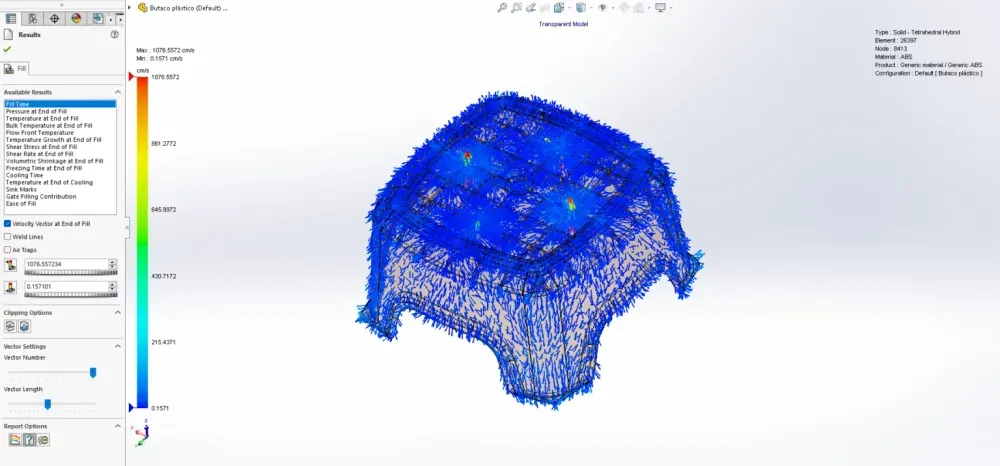
The velocity vector plot at the end of fill reveals something you can't see with any other tool: the molecular orientation of the plastic as it solidified.
Why does this matter? Because plastic isn't isotropic. The long polymer chains align with the flow direction, and this alignment determines the mechanical properties of the finished part.
For unfilled materials (neat resins):
The molecular orientation creates modest differences in mechanical properties between the flow direction and perpendicular to it. Spherical fillers help create a more uniform distribution.
For filled materials (glass fiber, carbon fiber, mineral):
The effect is dramatic. High aspect ratio fillers (like glass fibers) align strongly with the flow:
| Property Direction | Relative Strength | Relative Stiffness |
| Parallel to flow (with fiber alignment) | Highest | Highest |
| Perpendicular to flow (across fiber alignment) | 30–60% lower | 40–70% lower |
| Through-thickness | Lowest | Lowest |
This means a glass-filled nylon part can be extremely strong in one direction and surprisingly weak in another — and the velocity vector plot tells you which direction is which at every point in your part.
Priya's ABS stool used unfilled material, so the anisotropy was modest. But for engineers working with glass-filled nylon structural brackets or carbon-fiber-reinforced automotive panels, the velocity vector plot is essential for predicting real-world performance.
Pressure at End of Fill: The Filling Scorecard
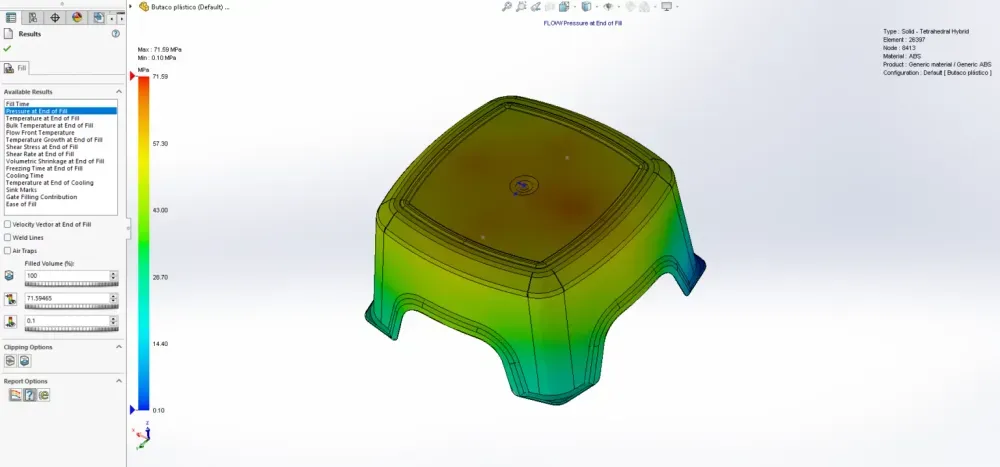
The pressure plot at end of fill is your primary diagnostic for whether the cavity has filled evenly and efficiently.
During injection, the screw pushes molten plastic into the cavity at a controlled forward velocity. As the plastic flows through the cavity, friction against the walls and the viscosity of the melt create a pressure drop along the flow path.
The pressure drop equation:
ΔP = (12 × η × Q × L) / (W × H³)
Where:
- ΔP = Pressure drop
- η = Melt viscosity
- Q = Volumetric flow rate
- L = Flow length
- W = Flow channel width
- H = Flow channel height (wall thickness)
Key insight: pressure drop is inversely proportional to the cube of wall thickness. This is why thin-walled parts require dramatically higher injection pressures.
| Wall Thickness | Relative Pressure Required | Typical Application |
| 3.0 mm | 1× (baseline) | Structural housing, thick containers |
| 2.0 mm | 3.4× | Consumer electronics enclosures |
| 1.5 mm | 8× | Thin-wall packaging |
| 1.0 mm | 27× | Ultra-thin packaging, connectors |
| 0.5 mm | 216× | Micro-molded components |
What the pressure plot tells you:
- Uniform pressure gradient from gate to end of fill = good filling
- Steep pressure gradient = high flow resistance (consider thicker walls or closer gate)
- Pressure exceeding machine capacity = short shot risk
- Asymmetric pressure distribution = uneven fill, potential warpage
If you detect a short shot (the cavity doesn't fill completely), the most effective single change is moving the injection location to the center of the part. This reduces flow length by half, which cuts the injection pressure requirement by roughly half.
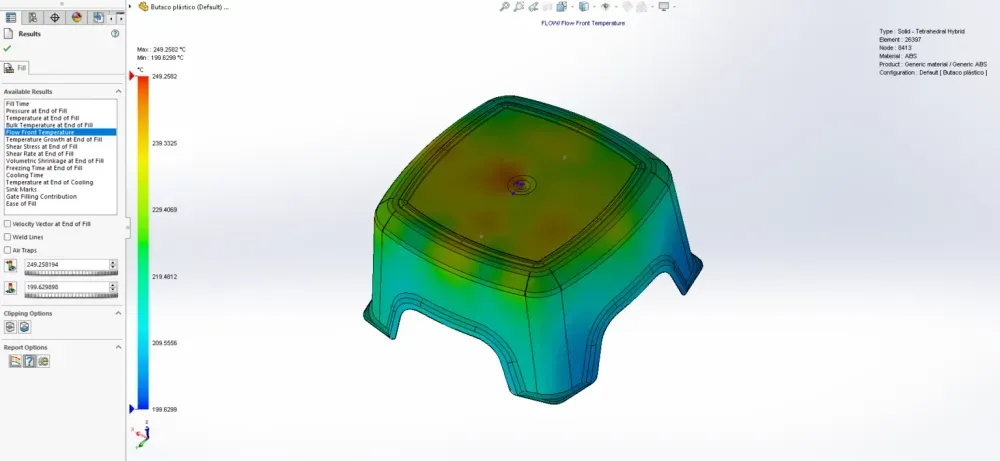
Temperature Plots: The Thermal Story of Your Part
SOLIDWORKS Plastics generates three distinct temperature plots at the end of fill, and each tells a different part of the thermal story.
Temperature at End of Fill
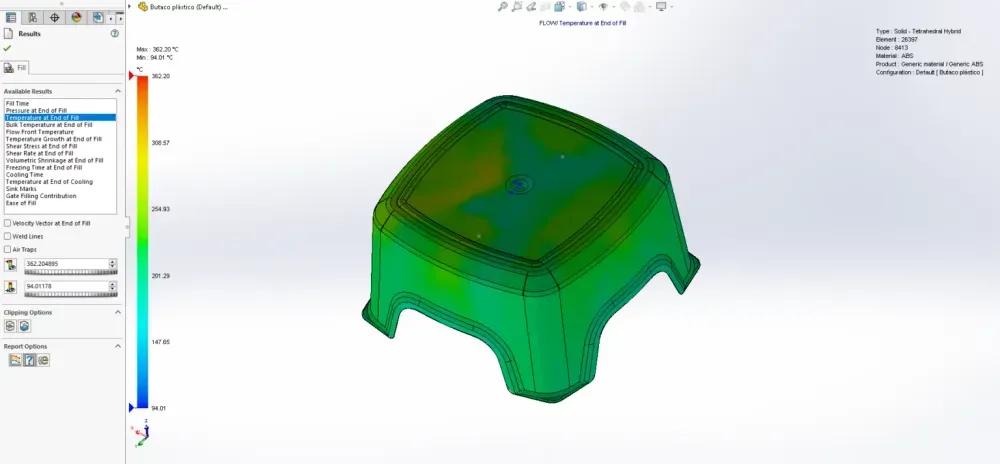
After the cavity fills, a thin frozen layer forms on the cavity wall wherever cooled plastic contacts the mold steel. This frozen layer's thickness depends on:
- The temperature difference between the melt and the mold
- The thermal conductivity of the plastic material
- Not the part wall thickness (a common misconception)
This frozen layer is critical because it reduces the effective flow channel — the plastic flows through the unfrozen core between two frozen layers. As the frozen layers grow thicker, the remaining flow channel narrows, increasing pressure drop and eventually preventing flow entirely.
Bulk Temperature at End of Fill
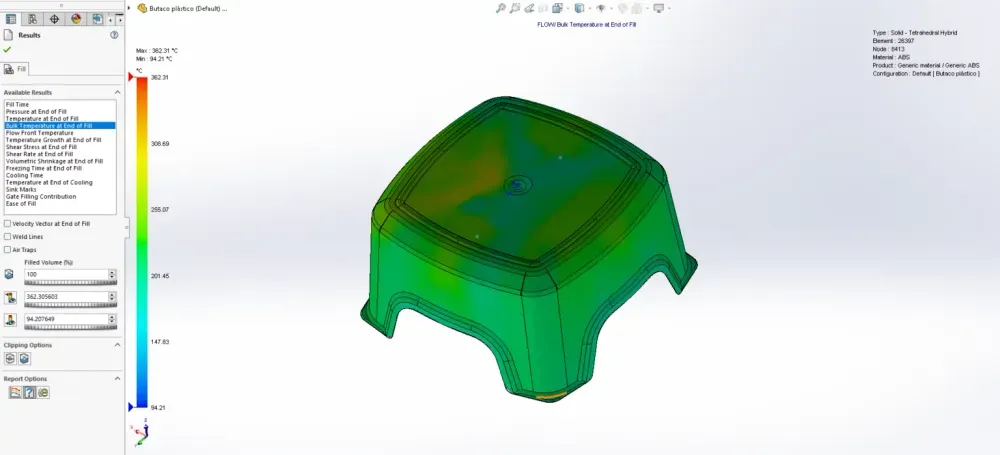
The bulk temperature plot shows how much the melt temperature has changed from the initial set temperature by the end of fill.
Color interpretation:
| Color | Meaning | Implication |
| Blue | Significantly cooled material | Stagnant flow — material sat too long and lost heat |
| Green/Yellow | Moderate temperature change | Normal flow conditions |
| Red | Material retaining near-original heat | Active flow just before fill completed |
Blue regions are particularly concerning — they indicate areas where material arrived early in the fill cycle and then sat stagnant while the rest of the cavity filled. This stagnant material has begun to solidify, which means it may not pack properly and could develop voids or sink marks.
Temperature Growth at End of Fill
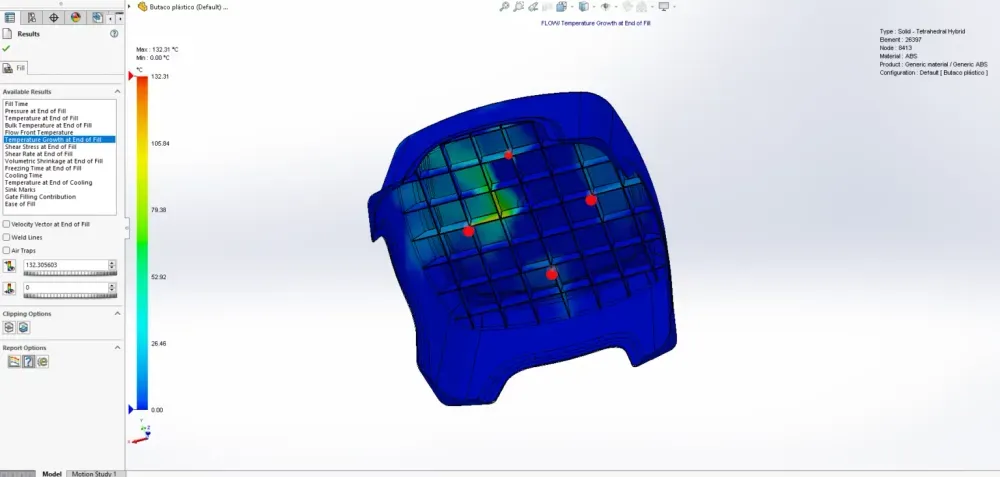
This is the plot that surprised Priya.
During injection, the polymer melt experiences shear heating — the friction of polymer chains sliding past each other generates heat. In extreme cases, the melt temperature inside the cavity can exceed the set melt temperature.
Conditions that cause excessive shear heating:
- Very short fill times (high injection speed)
- Small injection locations (the plastic is squeezed through a tiny opening)
- High-viscosity materials
- Materials with specific flow characteristics that generate heat under shear
Why shear heating matters:
If the temperature rises too far above the set melt temperature, the polymer can degrade — breaking down molecular chains, discoloring, losing mechanical properties, or generating gases that create voids and burn marks.
The temperature growth plot flags these hot spots before you ever run the mold.
Shear Stress and Shear Rate: The Forces Inside the Flow
These two related plots reveal the mechanical forces acting on the polymer melt during flow. Understanding them is essential for predicting material degradation, surface quality, and residual stress in the finished part.
Shear Stress at End of Fill
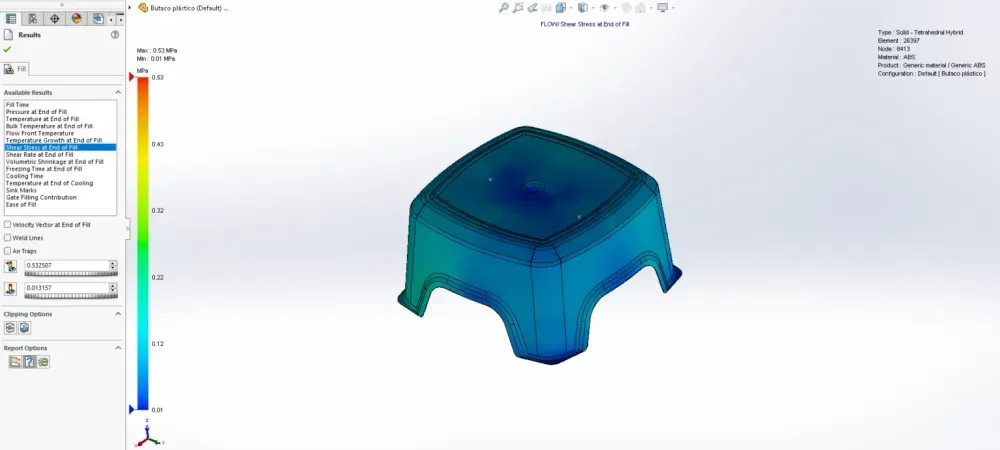
Shear stress is the force per unit area applied in a direction parallel to the flow plane. Think of it as the "sliding friction" force between layers of flowing plastic.
The formula:
τ = F / A
Where:
- τ (tau) = Shear stress
- F = Applied force parallel to flow
- A = Cross-sectional area of the material parallel to the force vector
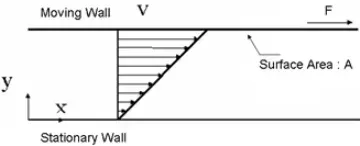
The key concept: in injection molding, the cavity wall is stationary and the plastic melt flows along it. The material touching the wall experiences the highest flow resistance, while material in the center of the flow channel moves with the least resistance.
Shear stress distribution across the flow channel:
     Cavity Wall (stationary)
     ████████████████████████████
→→→ HIGH shear stress zone ← Frozen layer / near-wall region
→→→→ Moderate shear stress ← Transition zone
→→→→→ LOW shear stress ← Center of flow
→→→→ Moderate shear stress ← Transition zone
→→→ HIGH shear stress zone ← Frozen layer / near-wall region
████████████████████████████
Cavity Wall (stationary)
Material along the cavity wall requires extra force to flow, creating higher shear stresses. Material in the center of the flow channel experiences far less resistance and therefore far less shear stress.
Why high shear stress matters:
- Can cause molecular chain scission (breaking of polymer chains)
- Leads to residual stresses that cause post-mold warpage
- Can exceed the material's shear stress limit, causing degradation
- Affects surface finish quality
Shear Rate at End of Fill

Shear rate measures how fast one fluid layer moves relative to an adjacent layer — the velocity gradient across the flow channel.
Shear rate distribution (from cavity wall to center):
| Position | Velocity | Shear Rate | Explanation |
| Cavity wall (frozen layer) | Zero | Zero (0.0 1/sec) | Frozen plastic doesn't move relative to wall |
| Just inside frozen layer | Increasing | Maximum | Molten plastic flows past frozen layer at high relative velocity |
| Transition zone | Moderate | Decreasing | Velocity gradient decreases toward center |
| Flow center | Maximum absolute velocity | Zero (local minimum) | Adjacent chains move at same speed — no relative motion |
The shear rate profile looks like this:
Shear Rate vs. Position Across Wall Thickness
Shear
Rate MAX · ·
↑ | · ·
| | · ·
| | · ·
| | · ·
| | · ·
| | · ·
0 ───|──────────··──────────→ Position
Wall Inside Center Inside Wall
(frozen) (frozen)
Two maximums (just inside each frozen layer)
Two minimums at walls (frozen = no movement)
One minimum at center (uniform velocity = no relative motion)
Critical thresholds:
Every plastic material has a maximum recommended shear rate. Exceeding it causes:
- Material degradation
- Surface defects (splay, jetting, tiger stripes)
- Loss of mechanical properties
- Discoloration
| Material | Maximum Recommended Shear Rate (1/sec) |
| ABS | 50,000 |
| Polypropylene | 100,000 |
| Polycarbonate | 40,000 |
| Nylon 6/6 | 60,000 |
| POM / Acetal | 40,000 |
| HDPE | 40,000 |
| PEEK | 30,000 |
If your simulation shows shear rates exceeding these values, you need to slow down the injection speed, increase wall thickness, or enlarge the gate.
Volumetric Shrinkage at End of Fill: Predicting Sink Marks and Voids
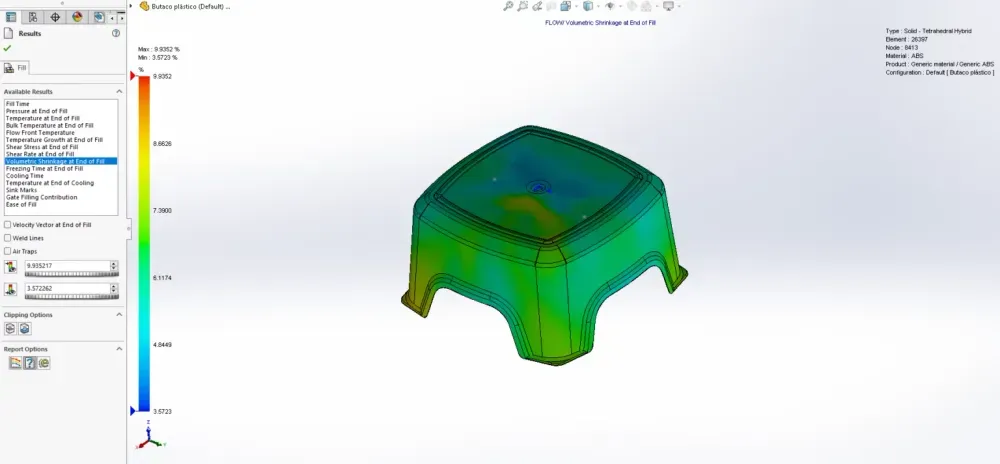
This was the plot that finally explained Priya's cracked stools.
Volumetric shrinkage measures how much the plastic contracts as it cools from melt temperature to solid. All plastics shrink during cooling, but the amount of shrinkage varies across the part depending on local cooling rates and packing pressure.
The shrinkage mechanism:
- Plastic fills the cavity at melt temperature
- Material touching the cavity wall cools first (forming the frozen layer)
- Interior material cools more slowly (surrounded by insulating plastic)
- As interior material cools, it contracts
- If the gate has frozen off (sealed), no additional material can enter to compensate
- The contraction creates either sink marks (surface depressions) or voids (internal vacuum bubbles)
Color interpretation of the volumetric shrinkage plot:
| Color | Shrinkage Level | Concern Level | Typical Cause |
| Blue/Green | Low shrinkage | Low risk | Thin, uniform sections with good packing |
| Yellow | Moderate shrinkage | Monitor | Thicker sections or areas far from gate |
| Red | High shrinkage | High risk — action needed | Thick sections without adequate packing |
High shrinkage in thick sections indicates the part hasn't undergone sufficient packing. Without adequate packing pressure maintained through the gate, thick sections will shrink significantly, pulling the surface inward (sink marks) or creating internal vacuum voids.
Sink Marks vs. Voids: What Determines Which You Get?
The determining factor is surface rigidity:
- If the surface is still soft when the core shrinks → the surface pulls inward → sink mark (surface depression)
- If the surface is already rigid when the core shrinks → the core separates from itself → void (internal vacuum bubble)
Voids appear as bubbles in transparent parts. They are not air bubbles — they're vacuum voids created when rigid outer surfaces hold their shape while the molten core contracts inward. In opaque parts, voids are invisible from outside; you must cut the part open to find them.
Where voids typically form:
- Thick sections of the part
- Transitions between thick and thin walls
- Around the rim of bosses
- Along the transition from a part wall to a rib
Shrinkage Values by Material
| Material | Mold Shrinkage (%) | Volumetric Shrinkage Note |
| ABS | 0.4–0.7 | Moderate, relatively uniform |
| Polypropylene | 1.0–2.5 | High shrinkage, crystalline |
| Nylon 6/6 (dry) | 0.8–1.5 | Anisotropic with fillers |
| Polycarbonate | 0.5–0.7 | Low shrinkage, amorphous |
| POM / Acetal | 1.8–2.5 | High shrinkage, crystalline |
| HDPE | 1.5–4.0 | Very high shrinkage |
| Glass-filled Nylon | 0.3–0.5 (flow), 0.8–1.2 (cross-flow) | Highly anisotropic |
Part Four: The Transformation — Mastering the Cooling Phase
Freezing Time at End of Fill
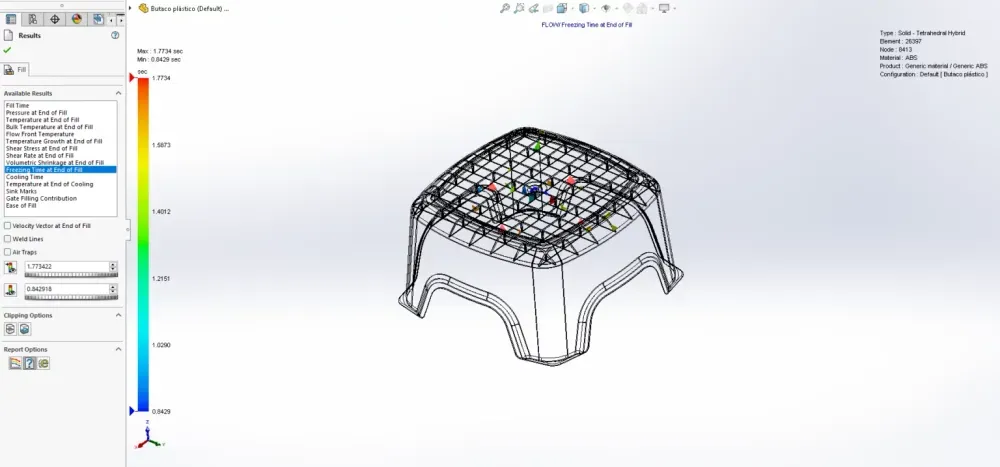
After Priya understood the filling defects, she moved to the next stage of the process — and discovered that cooling is where 70% of the total cycle time lives.
The freezing time plot shows how long it takes for molten plastic to cool down to its glass transition temperature (Tg) at each point in the part.
Key distinction:
The ejection temperature is NOT the glass transition temperature. The material's deflection temperature under flexural load (HDT) determines when you can eject the part. This is typically around two-thirds of the material's glass transition or melt temperature (measured in Kelvin).
Ejection Temperature Estimation:
T_eject ≈ (2/3) × T_glass_transition [in Kelvin]
For ABS with Tg ≈ 105°C (378 K):
T_eject ≈ (2/3) × 378 K = 252 K ≈ -21°C...
Wait — that doesn't seem right. The formula uses melt temperature for semi-crystalline polymers and Tg for amorphous polymers, but the "2/3 rule" is a rough guideline that applies differently by material type. For ABS, the actual HDT is typically 85–100°C, which governs ejection.
Practical ejection temperatures by material:
| Material | Glass Transition Temp (°C) | Typical Ejection Temp (°C) | Notes |
| ABS | 105 | 80–100 | Amorphous |
| Polypropylene | -10 (Tg), 165 (Tm) | 80–110 | Semi-crystalline, use Tm reference |
| Polycarbonate | 147 | 120–140 | High Tg, slow cooling |
| Nylon 6/6 | 50 (Tg), 265 (Tm) | 150–180 | Semi-crystalline |
| POM / Acetal | -60 (Tg), 175 (Tm) | 120–140 | Semi-crystalline |
Cooling Time: Where 70% of Your Cycle Lives
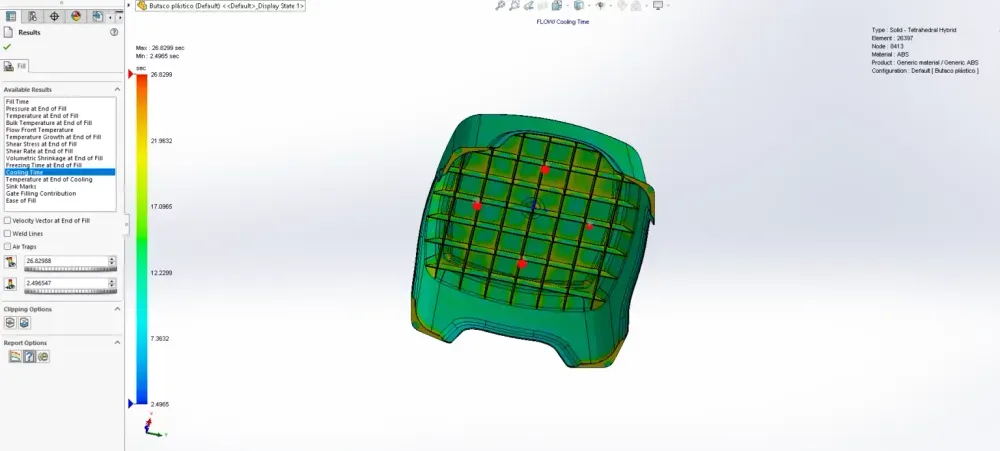
The cooling stage dominates the injection molding cycle. Here's the breakdown of a typical cycle:
| Cycle Phase | Typical % of Total Cycle |
| Mold close / clamp | 2–5% |
| Injection (fill) | 5–10% |
| Packing / holding | 10–15% |
| Cooling | 60–75% |
| Mold open / eject | 5–10% |
Two primary factors control cooling time:
- Melt temperature — higher melt = more heat to remove = longer cooling
- Mold temperature — higher mold = smaller temperature gradient = slower heat transfer = longer cooling
The critical relationship:
Cooling Time ∝ (Wall Thickness)²
This is a square relationship. Doubling the wall thickness doesn't just double the cooling time — it quadruples it.
| Wall Thickness | Relative Cooling Time | Practical Impact |
| 1.0 mm (baseline) | 1× | Fast cooling, short cycle |
| 1.5 mm | 2.25× | Moderate increase |
| 2.0 mm | 4× | Significant cycle time increase |
| 3.0 mm | 9× | Major cycle time impact |
| 4.0 mm | 16× | Often requires design rethink |
The universal design rule for cooling:
Make the part wall thickness as uniform as possible and as thin as safely allows. Every extra millimeter of thickness costs you exponentially in cycle time.
Priya's stool had a 4 mm seat connected to 2.5 mm legs. That difference meant the seat took over 2.5 times longer to cool than the legs — creating differential cooling that drove warpage and sink marks.
Temperature at End of Cooling
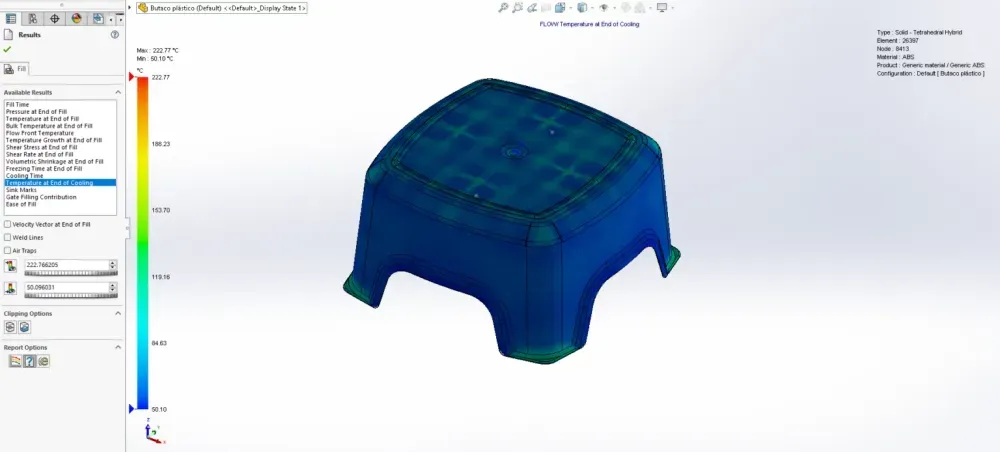
The end-of-cooling temperature plot shows the temperature distribution across the part when the cooling timer expires — specifically, when 90% of the part volume has dropped below the material's deflection temperature under flexural load.
The danger of non-uniform temperatures at ejection:
If thick regions are still significantly warmer than thin regions when the mold opens:
- Sink marks form as the still-warm thick sections continue to shrink after ejection
- Internal voids develop in sections that were still molten at ejection
- Warpage occurs as differential thermal contraction pulls the part out of shape
Design solution: uniform wall thickness. This is the single most effective design strategy for controlling cooling uniformity, dimensional accuracy, and cycle time.
Sink Marks: The Surface Defect Everyone Hates
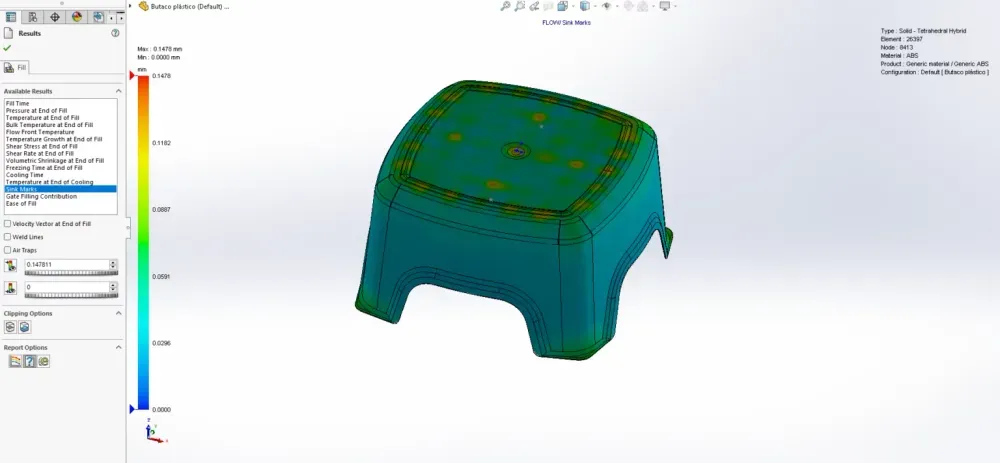
Sink marks are depressions on the surface of an injection-molded part. They're among the most common and most visible quality defects, and they drove the aesthetic complaints about Priya's stool.
The mechanism:
- Thicker sections take longer to cool than thinner sections
- The outer skin cools and solidifies while the interior is still molten
- As the molten core cools, it shrinks
- Plastic is a poor thermal conductor — heat can only escape through the solidified skin to the cavity wall
- The longer the core takes to cool, the more it shrinks
- The shrinking core pulls the surface inward, creating a depression
Sink mark prevention — design rules:
- Design with uniform wall thickness — the single most effective rule
- Place injection locations at thicker sections — allows higher packing pressure to compensate for shrinkage in thick areas
- Don't use gates that are too small — undersized gates freeze off before adequate packing pressure can be maintained
- Ribs and bosses: 60–80% of nominal wall thickness — this is the golden ratio
The rib-to-wall thickness ratio:
Rib Thickness = 0.6 × Nominal Wall Thickness (minimum)
Rib Thickness = 0.8 × Nominal Wall Thickness (maximum recommended)
Example for a 2.5 mm wall:
Minimum rib thickness = 0.6 × 2.5 = 1.5 mm
Maximum rib thickness = 0.8 × 2.5 = 2.0 mm
Exceeding 80% of wall thickness at ribs and bosses significantly increases sink mark risk. Below 60%, the rib may not fill properly or may lack structural contribution.
| Design Feature | Sink Mark Risk | Recommendation |
| Uniform wall thickness | Lowest | Always prefer this |
| Rib at 60% of wall | Low | Standard best practice |
| Rib at 80% of wall | Moderate | Acceptable for structural need |
| Rib at 100% of wall | High | Avoid — guaranteed sink marks |
| Boss with full wall thickness | Very high | Core out to 60–80% |
| Thick-to-thin transition (abrupt) | Very high | Use gradual taper (3:1 ratio minimum) |
Part Five: The Takeaway — Your Complete Simulation Workflow
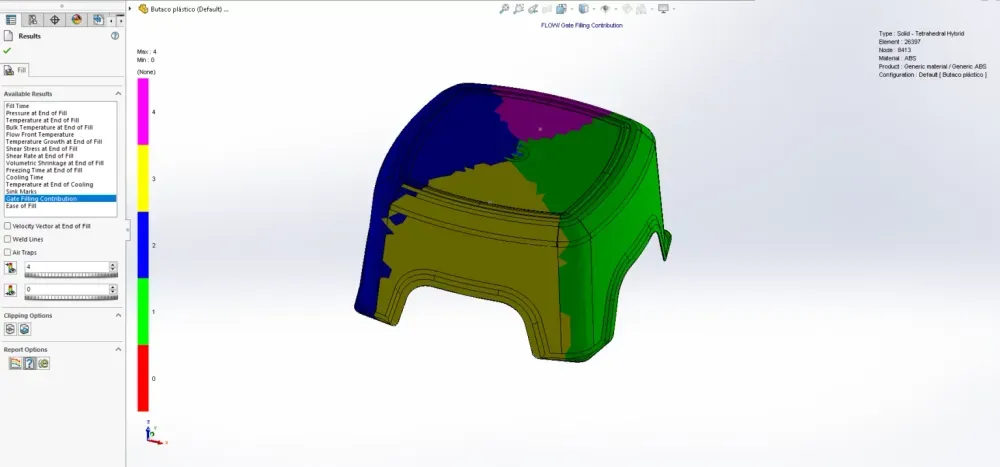
Multi-Gate Analysis: When One Gate Isn't Enough
For large or complex parts, a single injection location can't provide uniform filling. Priya's stool could work with one central gate, but larger parts — automotive bumpers, appliance housings, furniture components — often need multiple gates.
The tradeoff:
Using multiple injection locations reduces flow length and pressure requirements per gate, but creates weld lines at every interface where flow fronts from different gates meet.
The injection location filling contribution plot shows which regions of the cavity are filled by which gate. The boundary between regions is where the major weld lines will form.
Multi-gate design principles:
- Position gates so that weld lines fall in low-stress, non-visible areas
- Balance gate sizes so each gate fills its region in the same time
- Ensure the weld line interfaces are in compression rather than tension during use
- Consider the fill contribution ratio — each gate should fill roughly equal volumes
Ease of Fill: Your Go/No-Go Indicator
![[EASE OF FILL.webp]]
The ease of fill plot is the simplest, most actionable output from the simulation. It answers one question: can this cavity fill successfully?
Color interpretation:
| Color | Pressure Status | Action |
| Green | Normal injection pressure | Cavity fills easily — no changes needed |
| Yellow | Exceeds 70% of machine's maximum pressure | Warning — filling is marginal |
| Red | Exceeds 85% of machine's maximum pressure | Critical — high risk of short shot |
If you see yellow or red:
- Increase wall thickness in the restricted flow area
- Change injection location to reduce flow length
- Add additional injection locations to distribute flow
- Change material to a lower-viscosity grade
- Adjust processing parameters — higher melt temperature reduces viscosity
The ease of fill plot should be your first check after every simulation run. If it's not all green, address the filling issues before analyzing anything else.
The Complete Simulation Checklist
Here's the workflow Priya now follows for every new plastic part design — the systematic approach that eliminated her production failures:
Phase 1: Initial Fill Analysis
- [ ] Run fill time simulation
- [ ] Check ease of fill — all green?
- [ ] Review fill pattern — symmetric and uniform?
- [ ] Identify air trap locations — can they be vented?
- [ ] Map weld lines — are they in acceptable locations?
- [ ] Check pressure at end of fill — within machine capacity?
- [ ] Review temperature plots — any shear heating concerns?
- [ ] Verify shear rate — within material limits?
Phase 2: Gate Optimization
- [ ] Compare multiple gate location options
- [ ] Evaluate fill time uniformity for each option
- [ ] Check weld line positions for each option
- [ ] Select gate location with best balance of fill uniformity, weld line placement, and pressure requirements
Phase 3: Packing and Cooling
- [ ] Run pack analysis with selected gate
- [ ] Check volumetric shrinkage — any high-risk thick sections?
- [ ] Run cooling analysis
- [ ] Check temperature uniformity at end of cooling
- [ ] Predict sink mark locations and severity
- [ ] Estimate cycle time
Phase 4: Design Iteration
- [ ] Address any yellow/red regions in ease of fill
- [ ] Redesign wall thickness to reduce non-uniformity
- [ ] Adjust rib and boss dimensions to 60–80% rule
- [ ] Re-run simulation to verify improvements
- [ ] Iterate until all plots show acceptable results
The Engineering Reference: Key Formulas
Here's every critical formula you need for plastic part analysis in one place:
Shear Stress:
τ = F / A
Where τ = shear stress, F = force parallel to flow, A = cross-sectional area parallel to force
Pressure Drop (simplified):
ΔP = (12 × η × Q × L) / (W × H³)
Where η = viscosity, Q = flow rate, L = flow length, W = channel width, H = channel height
Cooling Time Proportionality:
t_cool ∝ h² / (π² × α)
Where h = wall thickness, α = thermal diffusivity of the material
Doubling Wall Thickness Effect:
If h₂ = 2 × h₁, then t_cool₂ = 4 × t_cool₁
Rib Thickness Rule:
t_rib = (0.6 to 0.8) × t_wall
Ejection Temperature Guideline:
T_eject ≈ HDT (Heat Deflection Temperature under flexural load)
Volumetric Shrinkage:
ΔV/V = f(material, packing pressure, cooling rate, wall thickness)
Specific values are material-dependent — always use material database values from SOLIDWORKS Plastics
The Master Defect Diagnostic Table
When something goes wrong, this table helps you trace the defect back to its root cause:
| Defect | Root Cause | Simulation Plot to Check | Fix |
| Short shot (incomplete fill) | Flow length too long, wall too thin, pressure too low | Ease of Fill, Pressure at End of Fill | Move gate, increase wall thickness, raise melt temp |
| Burn marks | Trapped air compressed and ignited | Air Traps | Add venting, change flow path to eliminate traps |
| Weld lines (weak or visible) | Flow fronts merging | Weld Lines, Velocity Vectors | Move gate to reposition weld lines |
| Sink marks | Insufficient packing in thick sections | Volumetric Shrinkage, Sink Marks | Uniform wall thickness, gate at thick section, rib 60–80% rule |
| Voids | Thick section core shrinkage after surface solidifies | Volumetric Shrinkage | Reduce wall thickness variation, improve packing |
| Warpage | Non-uniform shrinkage, differential cooling | Volumetric Shrinkage, Temperature at End of Cooling | Uniform wall thickness, balanced cooling |
| Surface splay / silver streaks | Excessive shear heating, moisture | Temperature Growth, Shear Rate | Slow injection, dry material, enlarge gate |
| Flash | Excessive pressure / clamp force exceeded | Pressure at End of Fill | Reduce injection pressure, check tool fit |
| Jetting | Small gate, high injection speed | Velocity Vectors, Shear Rate | Enlarge gate, reduce injection speed |
| Excessive cycle time | Thick walls, high mold temperature | Cooling Time, Freezing Time | Reduce wall thickness, lower mold temp |
Priya's New Reality
Six months after that cracked stool sat on the conference room table, Priya's team launched a redesigned product line — stools, chairs, and side tables, all injection molded in ABS.
Every design went through the full SOLIDWORKS Plastics simulation workflow. Every gate location was optimized. Every weld line was mapped and positioned. Every thick section was analyzed for shrinkage and sink marks.
The results:
- Zero tooling revisions on the stool (down from four)
- Manufacturing defect rate reduced by 95% during the design phase
- Scrap rate below 0.3% on the first production run
- Cycle time reduced by 22% through wall thickness optimization
- Customer returns: zero in the first quarter
"The simulation doesn't take long," Priya told her team. "What takes long is fixing problems you didn't catch. That's what we were spending our time on before."
The cracked stool still sits on her desk. Not as a reminder of failure, but as a benchmark. It's the last product she'll ever ship without simulation.
Your Next Step
You've just read the complete guide to every critical concept in SOLIDWORKS Mold Flow Analysis. You understand fill time, gate location, air traps, weld lines, shear stress, shear rate, volumetric shrinkage, cooling time, sink marks, and the defect diagnostic process.
Now it's your turn.
The next time you open a plastic part design, before you send it to tooling, ask yourself:
- Do I know where the weld lines will form?
- Do I know if the cavity will fill completely?
- Do I know where the air traps are?
- Do I know if the wall thickness is uniform enough?
- Do I know what the cycle time will be?
If the answer to any of those questions is "no" — you're designing in the dark. And the mold cavity will teach you the answers the expensive way.
Run the simulation. Catch the defect. Ship the perfect part.
What's the most expensive injection molding defect you've ever dealt with? Drop your war story in the comments — every failure is a lesson that can help someone else avoid the same mistake.